
The average Barnet home sold for £600,560 in July 2026, down 4.9% in a year (Land Registry). Flats down 7%, prices by type, and Britain's priciest street.
Ask what a home in Barnet is worth and you will get three different answers: the asking price in the agent’s window, the estimate on a portal, and the price homes actually change hands for. Only the last one is recorded as fact, by HM Land Registry when each sale completes, and that is the number this page reads. The short version for 2026: the average Barnet home sold for £600,560 in July 2026, prices have risen for five months but are still well below last summer, and the borough contains the most expensive street in Britain.
The headline figure for 2026
The average home in the London Borough of Barnet sold for £600,560 in July 2026, the provisional figure from the official UK House Price Index, which is built from completed Land Registry sales rather than asking prices. It is a mean average, not a median, so the very top of the Barnet market pulls it upward.
That is down 4.9% on a year earlier, when the average was £631,520, the borough’s highest since February 2023. The direction has changed recently, though. Barnet bottomed out at £581,606 in February 2026 and has risen for five months in a row since, by 1.1% in July alone. Over the same twelve months London as a whole fell 3.3% while England rose 1.1%. The July release also revised June down sharply, from £603,753 to £594,293; we explain that in our July house prices report.
A note on the bigger numbers you will see elsewhere. Rightmove quotes an average for Barnet around £728,000 and Zoopla around £674,000. Those are not wrong, they measure different things: different catchments, different timeframes and a different mix of homes, weighted toward the houses that sell on each portal. The Land Registry figure covers every completed sale in the whole borough, flats included, which is why it reads lower. Always check what area and what mix a house-price figure describes before comparing it with another one.
What a Barnet home costs by type
The borough average hides an enormous spread, wider than almost anywhere outside central London, because Barnet runs from mansion streets in Hampstead Garden Suburb to one-bed flats above the Edgware Road. The July 2026 averages from the UK House Price Index:
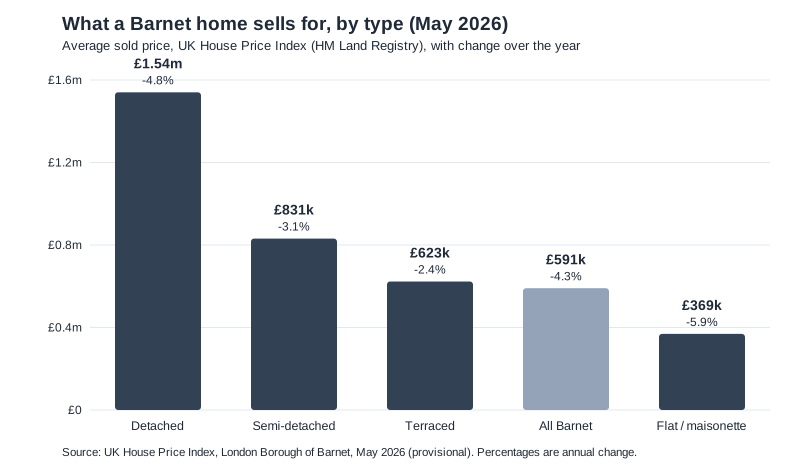
- Detached houses: £1,610,998, down 2.3% over the year, the smallest fall of any type. The smallest category by sales but the one that defines the Totteridge and Hampstead Garden Suburb end of the market.
- Semi-detached houses: £850,442, down 3.3%. The classic Barnet family home, from Finchley’s Edwardian streets to the 1930s semis of Mill Hill and Edgware.
- Terraced houses: £634,437, down 3.4%. Still the most affordable way into a house with a garden.
- Flats and maisonettes: £372,014, down 7.0%. The softest corner of the market by a distance, weighed down by mortgage costs and by the volume of new flats being built at Colindale and Brent Cross.
First-time buyers and home movers
The same index splits buyers in a useful way. A first-time buyer in Barnet paid an average of £469,358 in July 2026, down 5.5% on a year earlier. A home mover, someone selling one home to buy the next, paid an average of £787,614, down 4.1%. The £318,256 gap between those two figures is the size of the step from a first flat to a family house in this borough, and it is why so many Barnet moves wait for a school-places deadline before they happen.
Britain’s most expensive street is in Barnet
Barnet’s top end is not just expensive for London, it is the most expensive in the country. Rightmove’s 2026 most expensive streets analysis puts Winnington Road, on the Hampstead Garden Suburb border in N2, at number one in Great Britain with an average asking price of £12,538,095. The Bishops Avenue, the road long nicknamed Billionaires’ Row, is third nationally at £8,930,650. Both figures are asking prices, from streets with at least five homes for sale in January 2026, so treat them as the top of the market talking to itself rather than sale evidence; but no other London borough holds two of the country’s top three streets.
At the other end of the same borough, flats in Colindale, Burnt Oak and parts of Friern Barnet regularly complete below £300,000, which is how one borough produces both a £12 million street and a £372,014 average flat.
How Barnet compares to London and England
| Area | Average price | Change over the year |
|---|---|---|
| Barnet borough | £600,560 | -4.9% |
| London | £550,037 | -3.3% |
| England | £293,479 | +1.1% |
Barnet sits £50,523 above the London average and more than double the England average. The premium is the familiar outer-London bargain: more house per pound than the inner boroughs, with the Northern line and Thameslink into the centre, a long list of well-regarded schools, and green edges at Totteridge, Mill Hill and Monken Hadley. The fact that London fell while England rose is the story of 2026 so far: the adjustment is a capital phenomenon, concentrated in exactly the higher-priced boroughs like this one.
What it means for you
If you are selling, the market is telling you to price on this year’s evidence, not on a 2022 valuation or a neighbour’s asking price. Five rising months do not undo a year of falls, and the recent months are provisional: June was revised down by £9,460 in a single release. If you are buying, a 4.9% annual fall is real negotiating room; flats are the softest part of the market, down 7.0% on the year, and new-build supply at Colindale and Brent Cross keeps sellers honest. Factor in the council tax band of anything you view, since that bill runs at £1,400 to £4,300 a year in Barnet depending on band. If you are staying put, your home is worth a little less on paper than last year and roughly what it was in 2021; after the run prices had before that, a slow leak rather than a fall is the soft version of this adjustment.
Frequently asked questions
What is the average house price in Barnet?
The average home in the London Borough of Barnet sold for £600,560 in July 2026, according to the provisional UK House Price Index built from HM Land Registry completed sales. Portal averages for Barnet read tens of thousands higher because they cover a different area and mix of homes.
Are Barnet house prices falling?
Over the year, yes, but they have risen for the last five months. Prices were down 4.9% in the year to July 2026, a faster fall than the London average of 3.3%, while England as a whole rose 1.1%. Flats fell hardest, down 7.0%; detached houses held best, down 2.3%. On the month, July was up 1.1%.
How much is a house in Barnet compared to a flat?
In July 2026 a detached house averaged £1,610,998, a semi £850,442, a terrace £634,437 and a flat £372,014. The average first-time buyer paid £469,358.
What is the most expensive street in Barnet?
Winnington Road, N2, which Rightmove’s 2026 analysis ranks the most expensive street in Great Britain, with an average asking price of about £12.5 million. The Bishops Avenue is third nationally at about £8.9 million.
Where can I check what a specific house in Barnet sold for?
Every completed sale in England and Wales is public. Look up any street or address free on the HM Land Registry price paid search, or browse the same data on Rightmove and Zoopla.
Sources
- UK House Price Index, Barnet (HM Land Registry) for the borough average, property-type, buyer-type and monthly figures (July 2026, provisional)
- UK House Price Index open data for the London and England comparators
- Rightmove, Britain’s most expensive streets 2026 for Winnington Road and The Bishops Avenue
- Rightmove Barnet sold prices and Zoopla Barnet for portal-average context
- HM Land Registry price paid search to check an individual address
Figures are provisional and revised as more sales complete. Checked against the UK House Price Index on 17 September 2026; the August 2026 index is due from the Land Registry in mid October. Confirm the latest month against the linked sources before making a decision. Related: Barnet council tax bands, Barnet planning applications and parking in Barnet.
Have your say